Heart Attack Prediction Model
by L. Mark Coty
Project Objective: To develop a predictive model using logistic regression and other machine learning techniques to determine the likelihood of patients experiencing a heart attack, based on clinical and diagnostic data.
GitHub repository here. Run the notebook.
The dataset contains data which can be used to predict the likelihood that a patient will suffer a heart attack. It can be found here.
Feature classification:
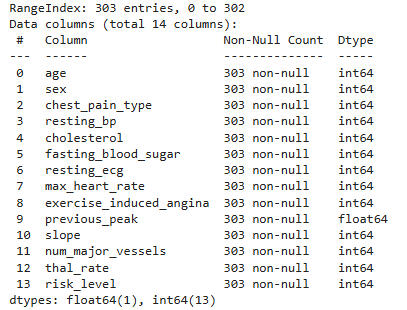
Shape of Data: 303×14
The categorical columns are: 'sex', 'exercise-induced-angina', 'num-major-vessels', 'chest-pain-type', 'fasting-blood-sugar', 'resting-ecg', 'slope', 'thal-rate'
The continuous columns are: 'age', 'resting-bp', 'cholesterol', 'max-heart-rate', 'previous-peak'
The target variable is risk-level (0: Less Risk, 1: High Risk)
Key for the categorical features:
Sex: 0 = female, 1 = male
Exercise-induced angina: 0 = no, 1 = yes
Number major vessels: 0 to 4
Chest pain type: 0 = typical angina, 1 = atypical angina, 2 = non-anginal, 3 = asymptomatic
Fasting blood sugar: 0 = less than or equal to 120 mg/dl, 1 = greater than 120 mg/dl
Resting ECG: 0 = normal, 1 = ST-T wave normality, 2 = left ventricular hypertrophy
Slope = 0, 1, 2
Thal rate = Thalium stress test result: 0, 1, 2, 3,
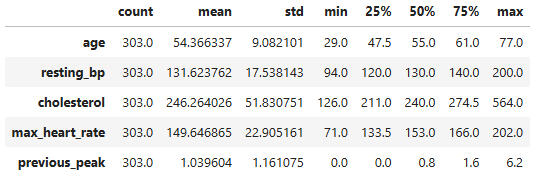
Summary statistics for the continuous features:
Data types and counts for all columns:
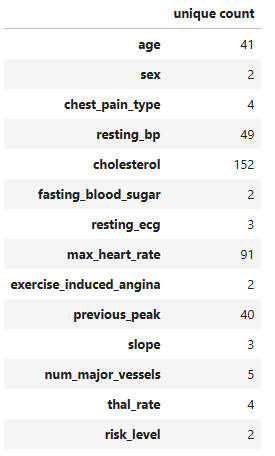
Unique value counts for all features:
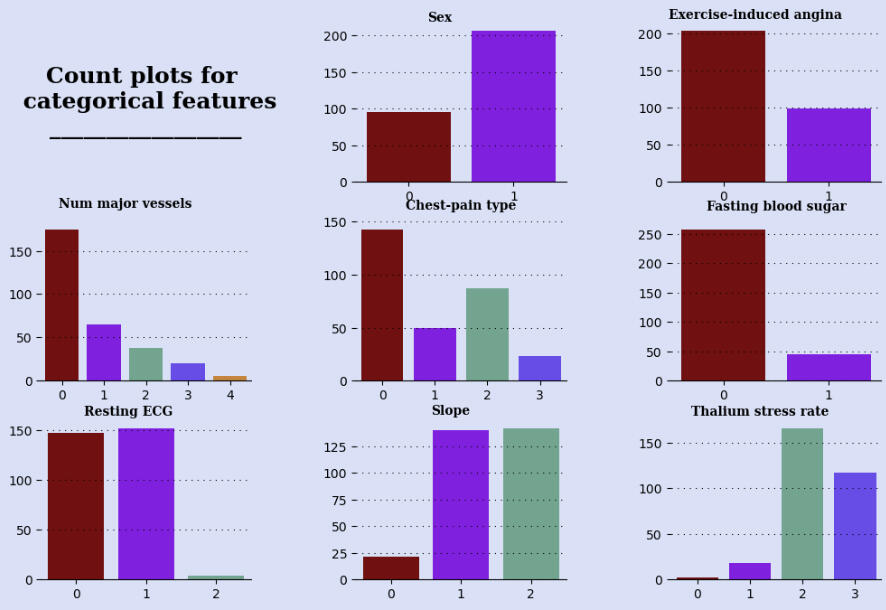
Observations from the above bar graphs:
Our data includes about twice as many males as females.
Twice as many patients experienced no exercise-induced angina compared with those who did experience it.
Number of major vessels is very right-skewed.
Chest pain type is mostly typical angina, with non-anginal pain the next most frequent.
The vast majority of patients had fasting blood sugar below or equal to 120 mg/dl.
Nearly all patients had normal or ST-T wave normal resting ECGs.
Slopes were most often split between 1 and 2, with few 0s. This refers to the rate of increase of heart rate in stress tests.
Thalium stress rate is left-skewed, with most patients having higher rates, and almost none with a rate of 0.
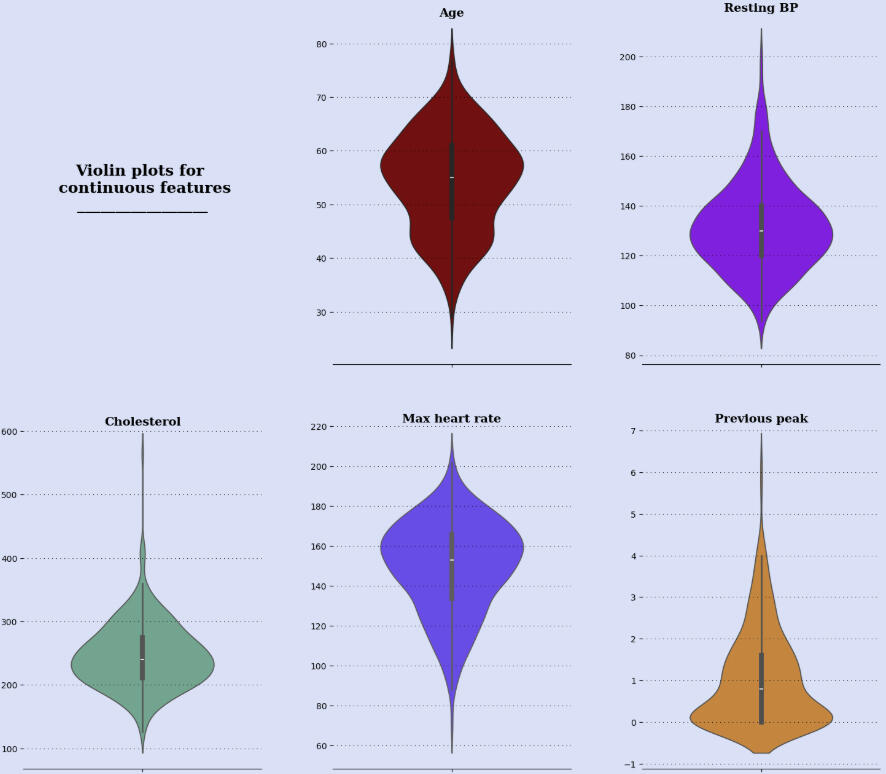
Observations from the above plots:
Most patients are between 40 and 65 years old, with outliers as low as the low 20s and the mid 80s.
Most patients' resting blood pressures (systolic) are between 115 and 145, with outliers as low as near 80 and as high as over 200.
Most patients' cholesterol levels are between 175 and 300, with outliers as low as the 90s and as high as 600.
The max heart rates are mostly between 120 and 180, with outliers as low as below 60 and as high as nearly 220.
The previous peak data is very right-skewed, with most data from near -1 to about 2.5. There outliers as high as 7.
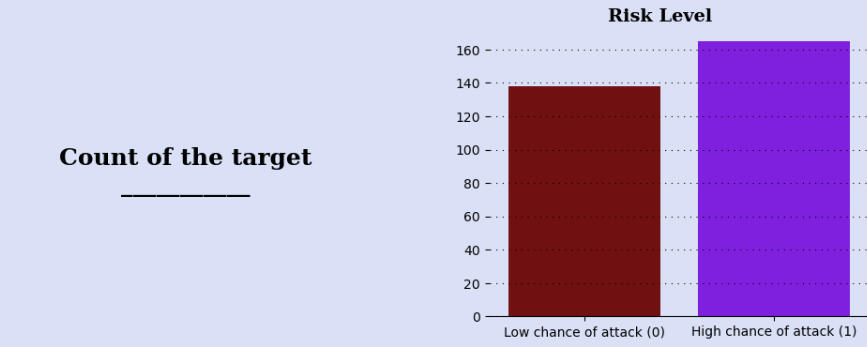
Observation: The data is nearly evenly split with respect to the target variable, heart attack risk level.
Heatmap of continuous features:
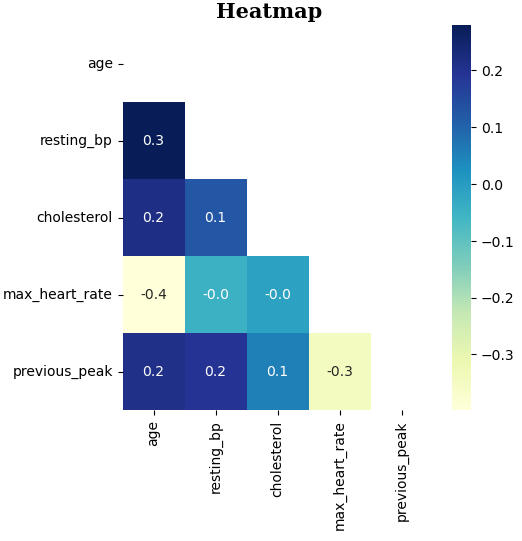
Observation from the heatmap: There do not appear to be any significant correlations between pairs of continuous features.
Distribution of continuous features according to target variable:
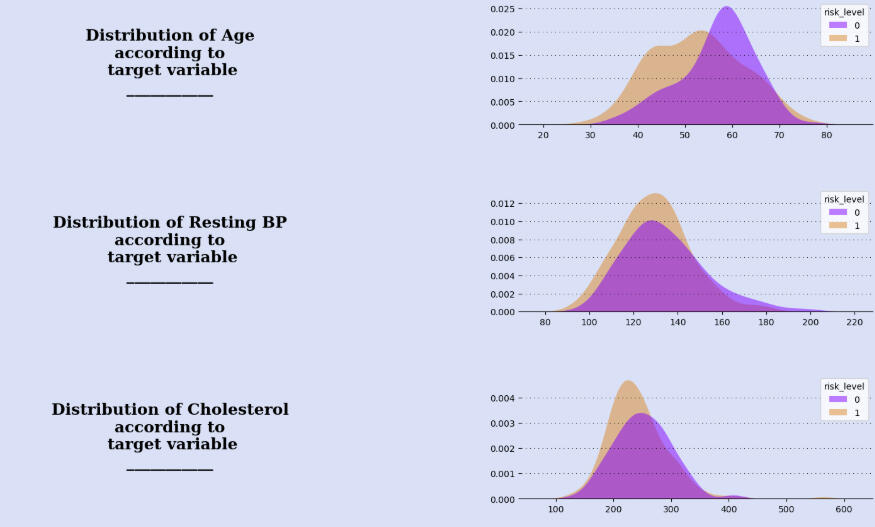
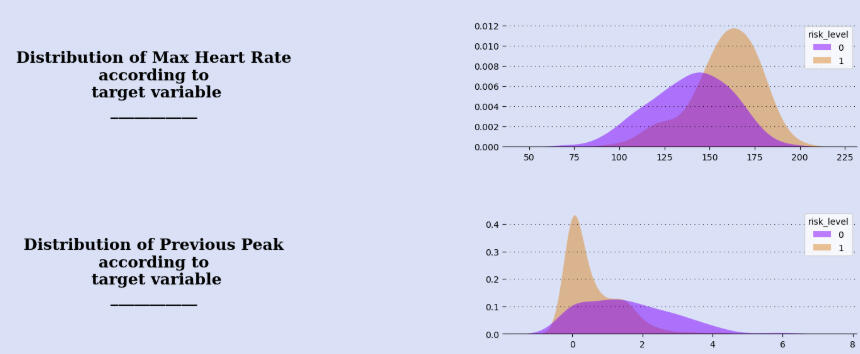
Observations from the above graphs:
For patients with low risk level, the graph's mode is 60 with a marked left-skew shape. For high-risk patients, the graph is more mound-shaped and with a slightly lower mode. The ranges of the graphs are similar.
The resting BP graphs are very similar for both risk levels.
The cholesterol graphs are also very similar, with high-risk patients actually having the peak at a lower level.
High-risk patients have noticeably higher max heart rates than low-risk patients.
There is a marked difference in the graphs of previous peak. Most high-risk patients score between 0 and 1. The graph for low-risk patients is mound-shaped, with a fairly uniform distribution between 0 and 3.
Plots of other features with respect to risk level:
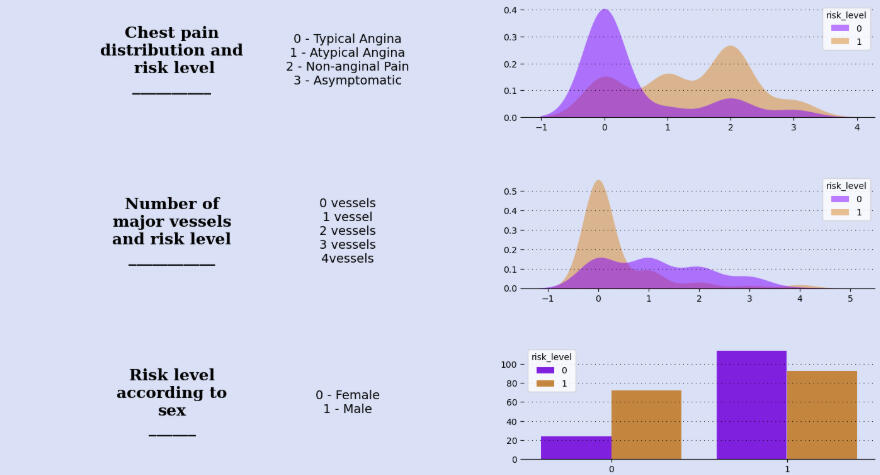
Observations from the above graphs:
Typical angina seems to be strongly associated with low risk, while chest pain of all types is associated with high risk, especially non-anginal pain.
Similarly, 0 vessel involvement is highly associated with low risk, while high-risk seems to be only slightly right-skewed with respect to vessels.
Females have three times high risk as low risk, while males are more nearly evenly distributed between high and low.
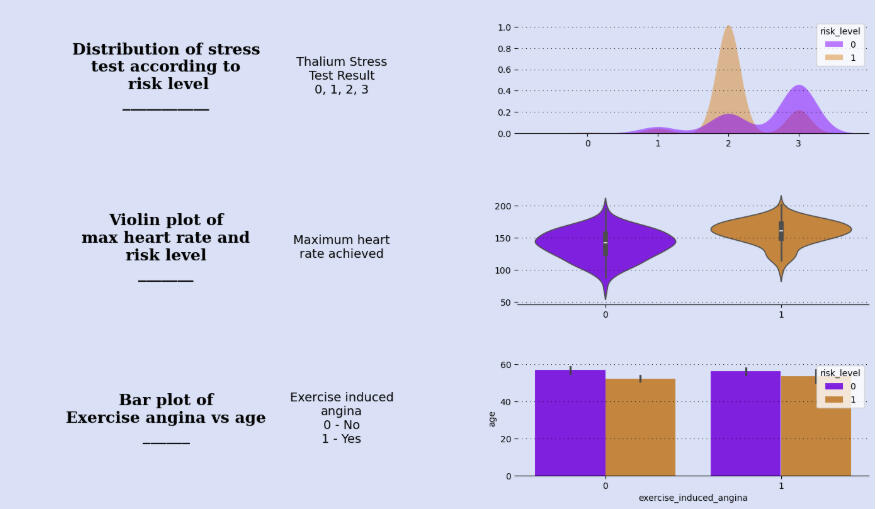
A thalium stress test result of 2 is highly associated with high risk, while 3 is less so. Low-risk levels increase as stress test scores increase, but only slightly until a score of 3 is reached.
The distributions for max heart rate achieved are similar, though the high-risk group has a higher median and a smaller range.
Exercise-induced angina appears independent of age and risk-level.
Heatmap of all features and target:
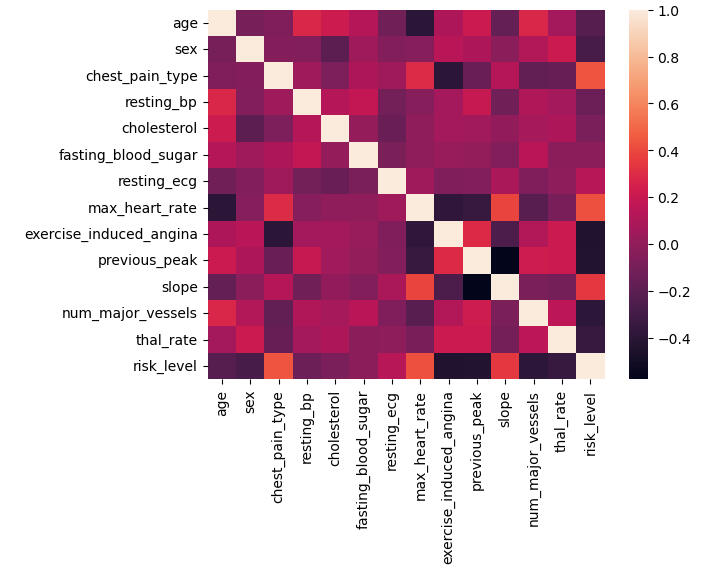
Observation from the heatmap: Sex, exercise-induced angina, previous peak, and number of major vessels have the most correlation with risk-level.
Classifier Model Processes and Results:
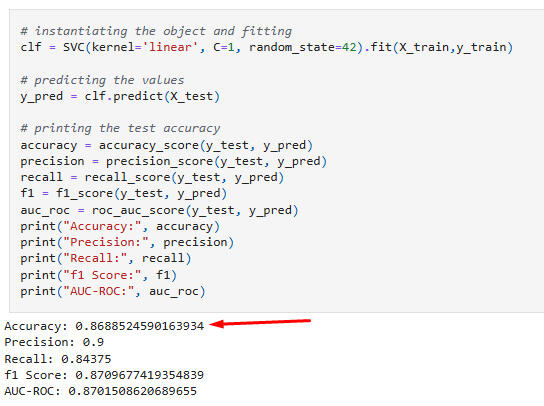
Support Vector Machines:
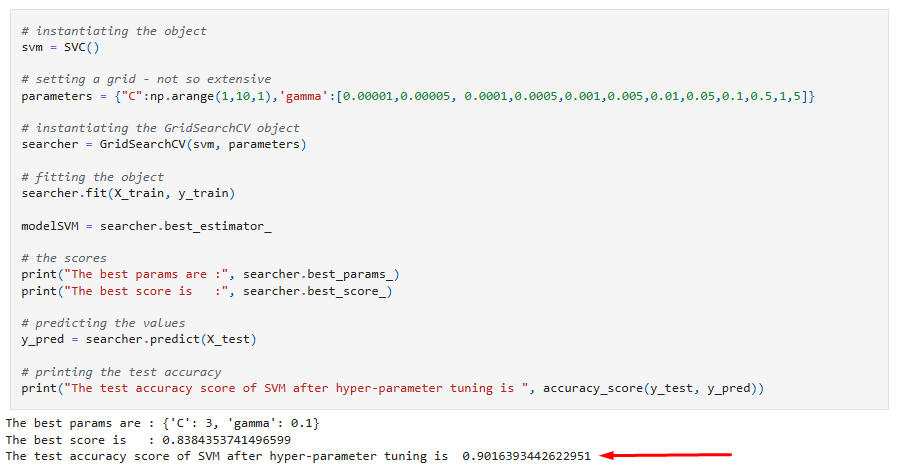
Hyperparameter tuning of SVC:
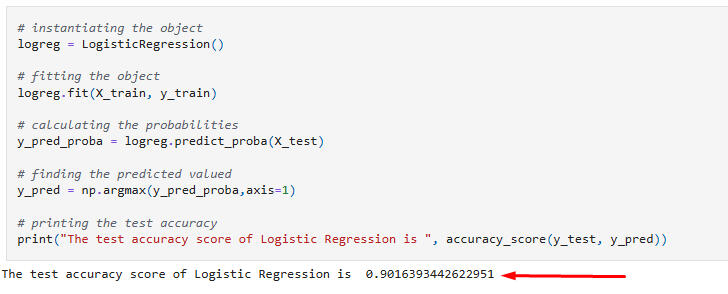
Logistic Regression:
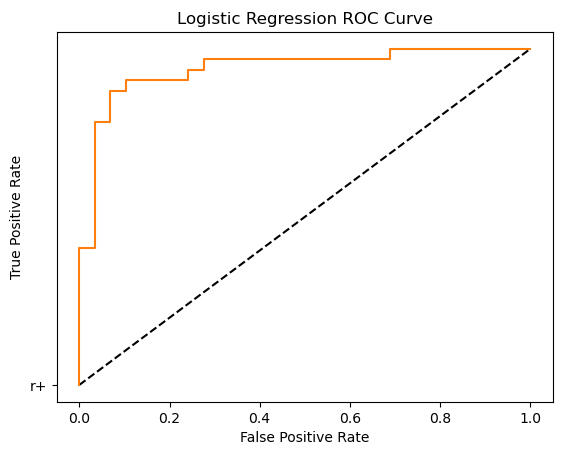
ROC Curve:
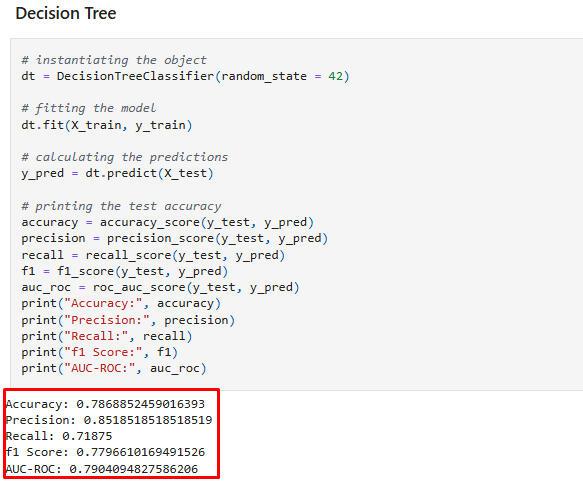
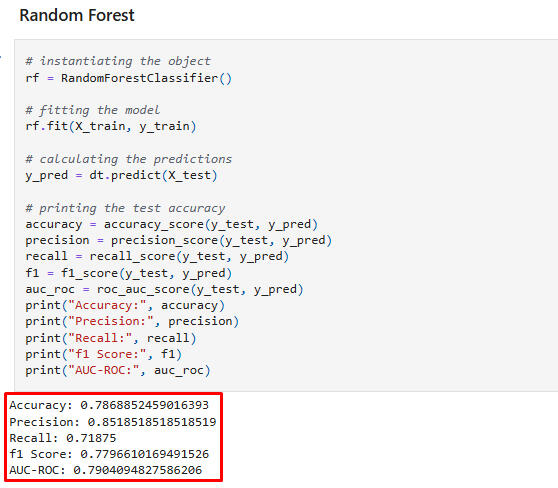
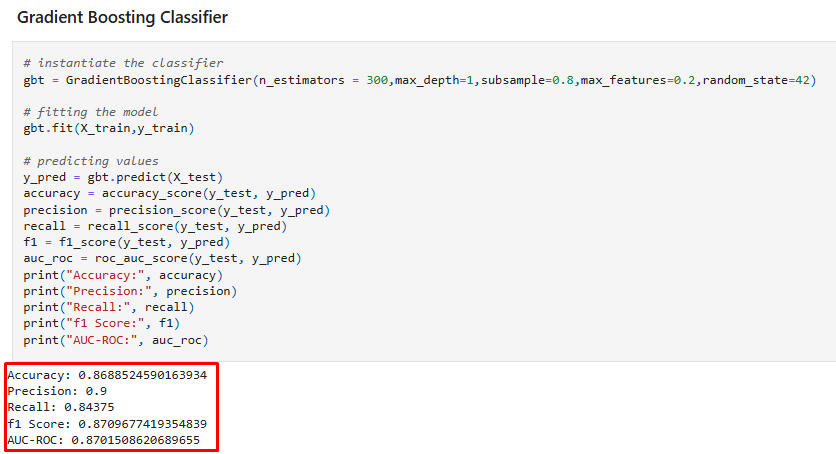
Tree Models
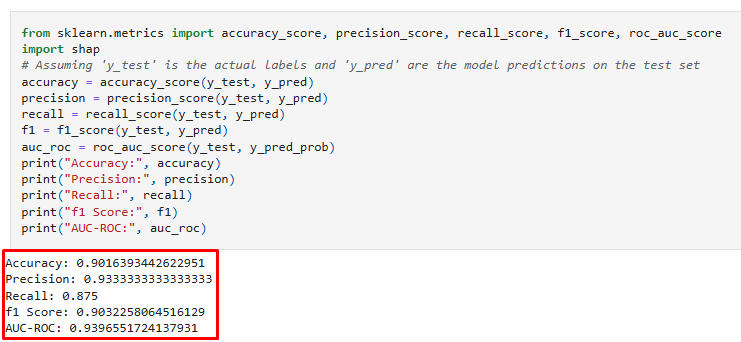
Conclusion on Classifiers: The test accuracy score, 0.90, of SVM (after hyperparameter tuning) and Logistic Regression is the best of the models fitted with all features.
Confidence Intervals:
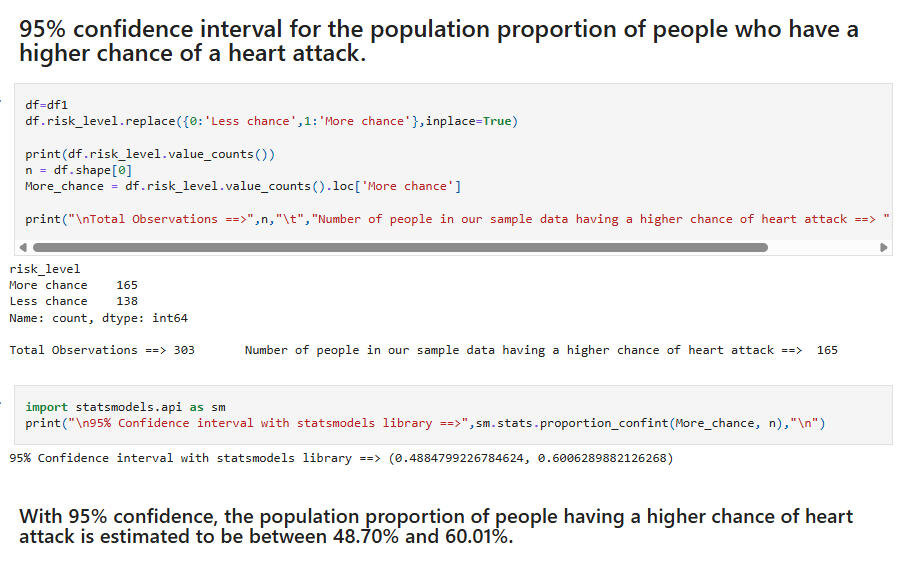
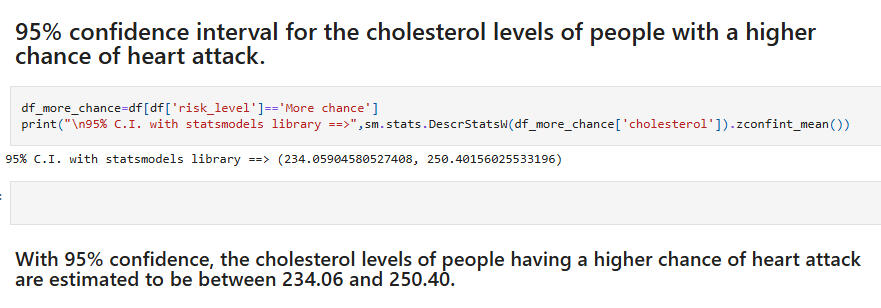
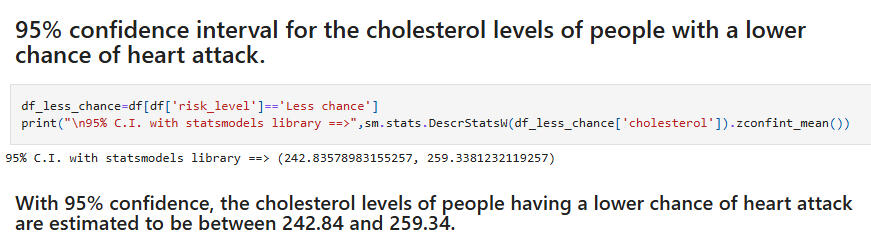
The overlap between these intervals -- with the high-risk group having the lower numbers -- is curious. It would seem to indicate a greater contribution to risk level coming from some subset of the other features.
Hypothesis Tests:
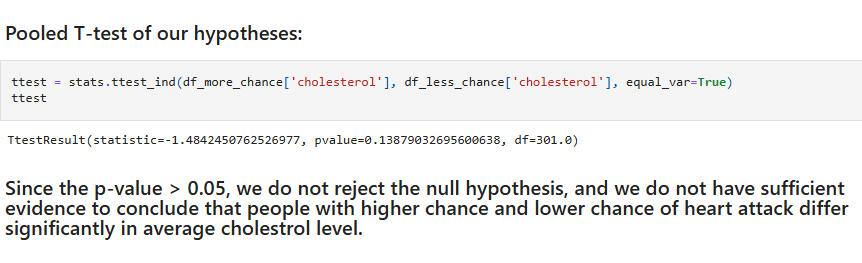
Hypothesis Test 1:Null: People with higher chance and lower chance of heart attack do not differ significantly in average cholesterol level.Alternative: People with higher chance and lower chance of heart attack differ significantly in average cholesterol level.(Note: We first performed the Shapiro Wilk Test for normality of the cholesterol feature and the Levene Test of the null hypothesis that the population variances are equal/homogenous.)
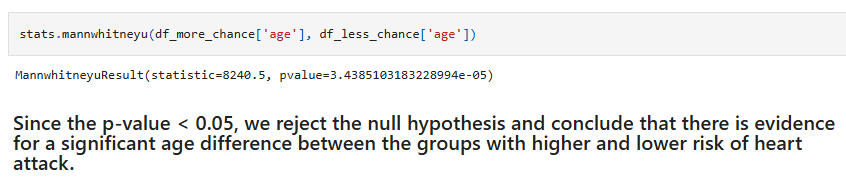
Hypothesis Test 2:Null: People with higher chance and lower chance of heart attack do not differ significantly in age.Alternative: People with higher chance and lower chance of heart attack differ significantly in age.(Again, Shapiro Wilk and Levene tests were performed. Due to the results of these, the Wilcoxon rank-sum test was used for the hypothesis test.)
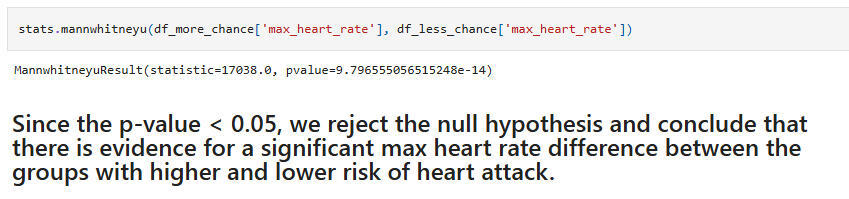
Hypothesis Test 3:Null: People with higher chance and lower chance of heart attack do not differ significantly in max heart rate.Alternative: People with higher chance and lower chance of heart attack differ significantly in max heart rate.(Again, the Wilcoxon rank-sum test was used for the hypothesis test.)
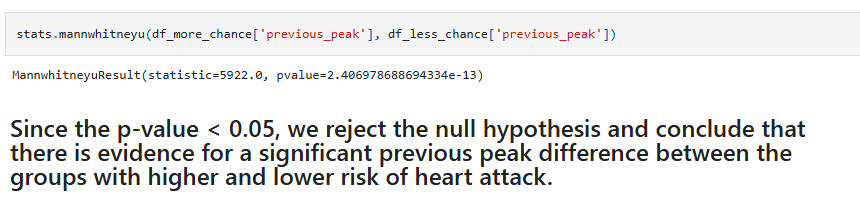
Hypothesis Test 4:Null: People with higher chance and lower chance of heart attack do not differ significantly in previous peak.Alternative: People with higher chance and lower chance of heart attack differ significantly in previous peak.(Again, the Wilcoxon rank-sum test was used for the hypothesis test.)
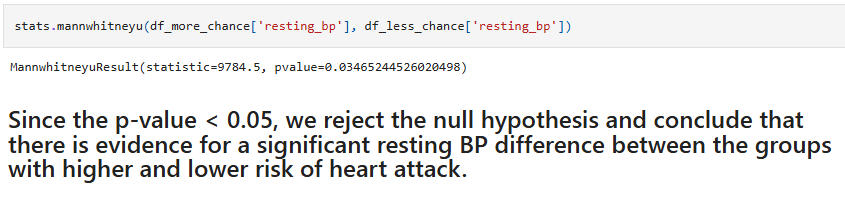
Hypothesis Test 5:Null: People with higher chance and lower chance of heart attack do not differ significantly in resting blood pressure.Alternative: People with higher chance and lower chance of heart attack differ significantly in resting blood pressure.(Again, the Wilcoxon rank-sum test was used for the hypothesis test.)
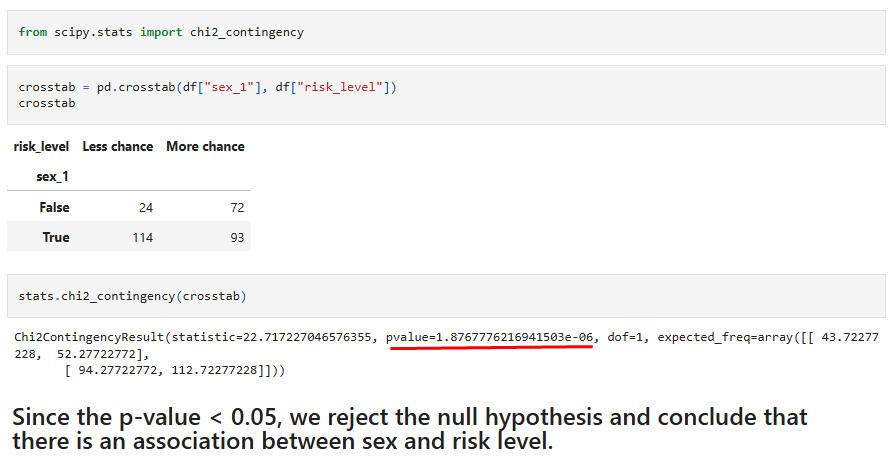
Hypothesis Test 6:Chi-Square test for association between the feature "sex" and the target "risk level."
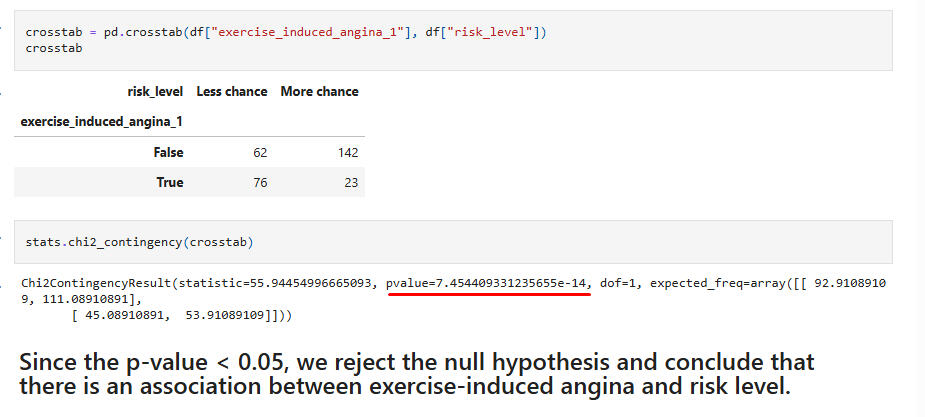
Hypothesis Test 7:Chi-Square test for association between the feature "exercise-induced angina" and the target "risk level."
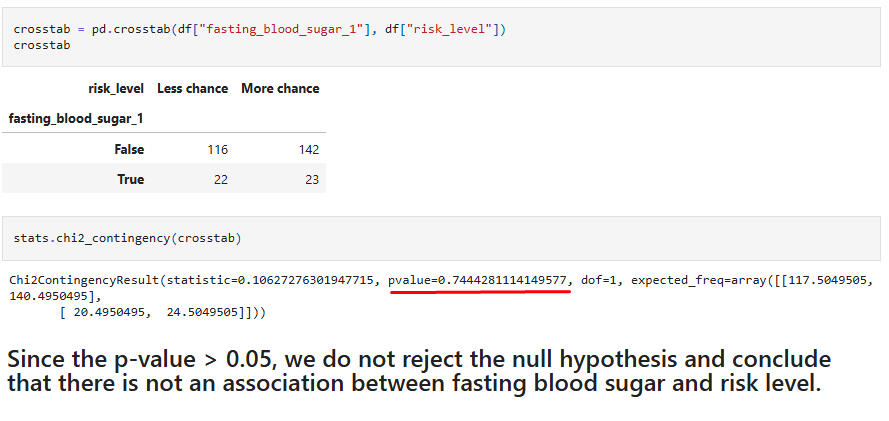
Hypothesis Test 8:Chi-Square test for association between the feature "fasting blood sugar" and the target "risk level."
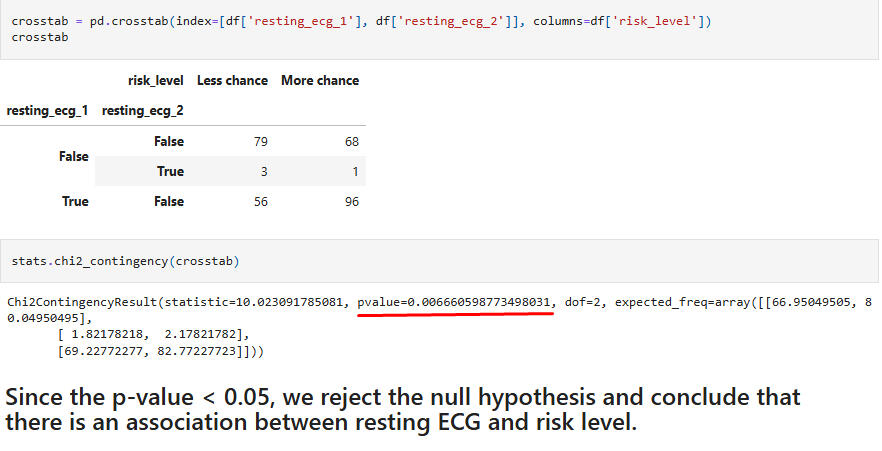
Hypothesis Test 9:Chi-Square test for association between the feature "resting ECG" and the target "risk level."
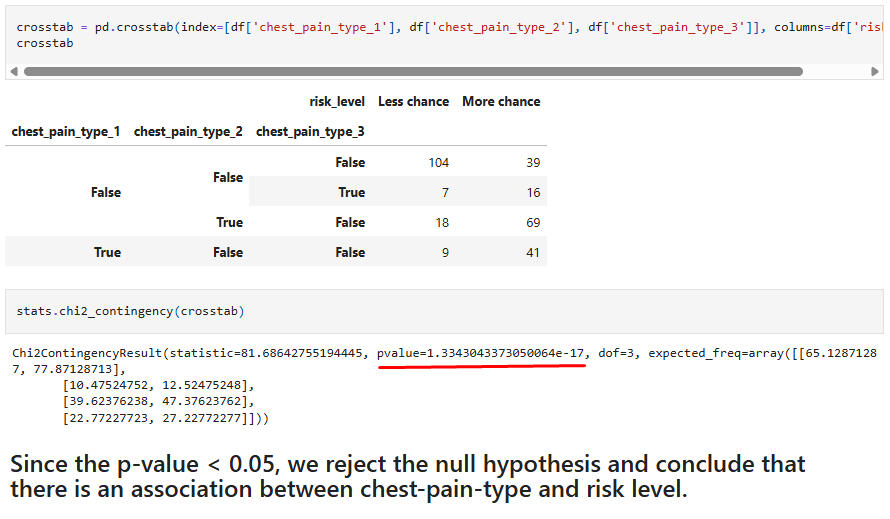
Hypothesis Test 10:Chi-Square test for association between the feature "chest-pain type" and the target "risk level."
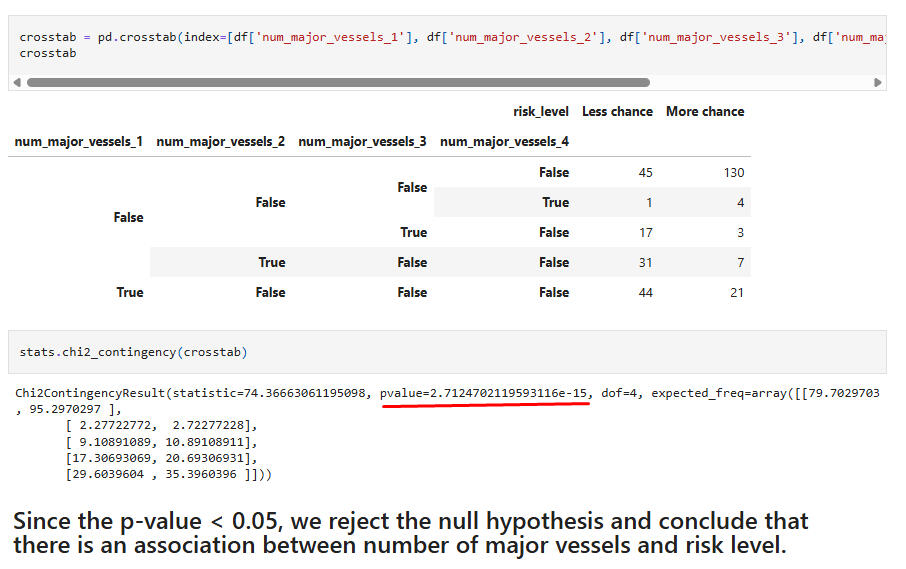
Hypothesis Test 11:Chi-Square test for association between the feature "number major vessels" and the target "risk level."
Final Observations on the Hypothesis Tests:
Test 1: This was slightly surprising, given that cholesterol is usually considered a major factor for heart attack risk. However, this result was corroborated by the overlapping confidence intervals found above.
Test 2: The significance of age between the risk groups is an expected result.
Test 3: The importance of max heart rate during the stress test is not surprisingly associated with heart attack risk.
Test 4: Previous peak rate is also associated with risk, as in Test 3.
Test 5: Blood pressure and heart attack risk are associated, which is to be expected.
Test 6: The association with sex is commonly assumed, and is present here. However, there is research which indicates that women are less likely to be diagnosed with heart attacks, even in the midst of them.
Test 7: Again, it seems intuitive that exercise-induced angina would be associated with heart attack risk.
Test 8: The lack of association between blood sugar levels and risk is not surprising. Things might look different, though, had diabetic and non-diabetic levels been studied.
Test 9: It is to be expected that an ECG would detect differences between the risk groups.
Test 10: Here we are getting another expected result, with chest pain type differentiating the risk groups.
Test 11: The condition of the major vessels supplying blood to the heart and heart attack risk is a final, expected, result.